MarketSphere
We rebuilt the entire stock market as a galaxy you can fly through.
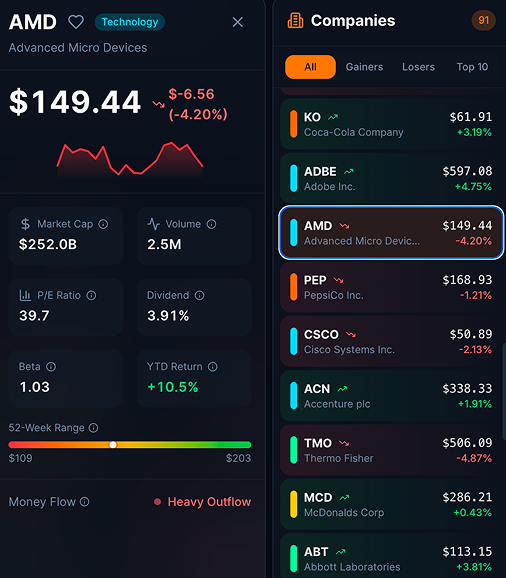
An experimental market-intelligence interface that renders the S&P 500 as a navigable galaxy of capital. Each company is a sphere, positioned by sector, performance, and volatility, connected by particle streams of money in motion.
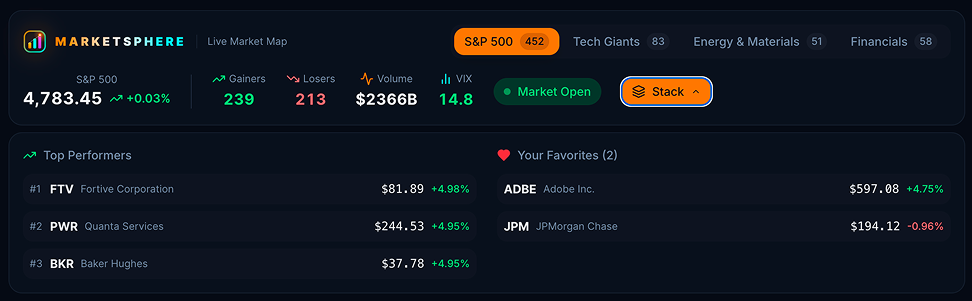
Traditional market dashboards are dense, text-first, and built for traders who already know what they are looking for. They give you no sense of scale, no sense of motion, no sense of place.
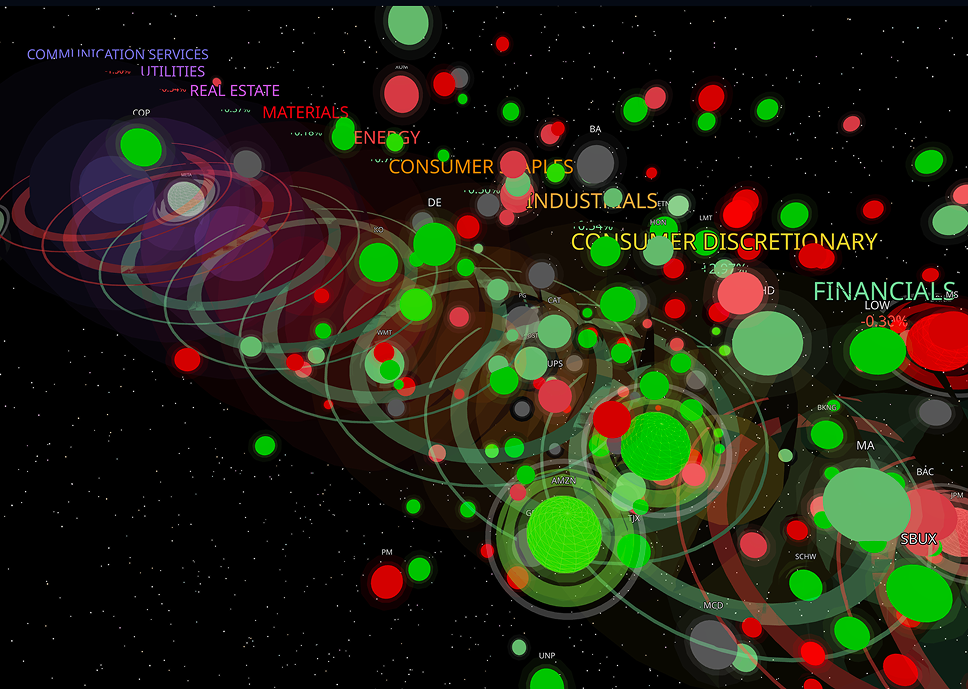
Three spatial axes carry three dimensions at once. Sector groups companies into nebulae. Vertical position is year-to-date return, winners floating above the plane. Depth is volatility. One orbit of the camera and the structure of the market is just there.
The money-flow particle layer is the thing everyone reacts to first. It makes capital rotation visible in a way no rotating bar chart ever manages.
Next project